ISFT-Series-2: Technical Analysis & Trading Certificate
Your job-ready path into trading and analysis: read the economy, read the chart, build a plan you can test. 12 modules, 24 credits and 240 learning hours online, with a live session every week.
~24 weeks (240 learning hours)
No formal entry requirements. Series 1, or equivalent market knowledge, is recommended
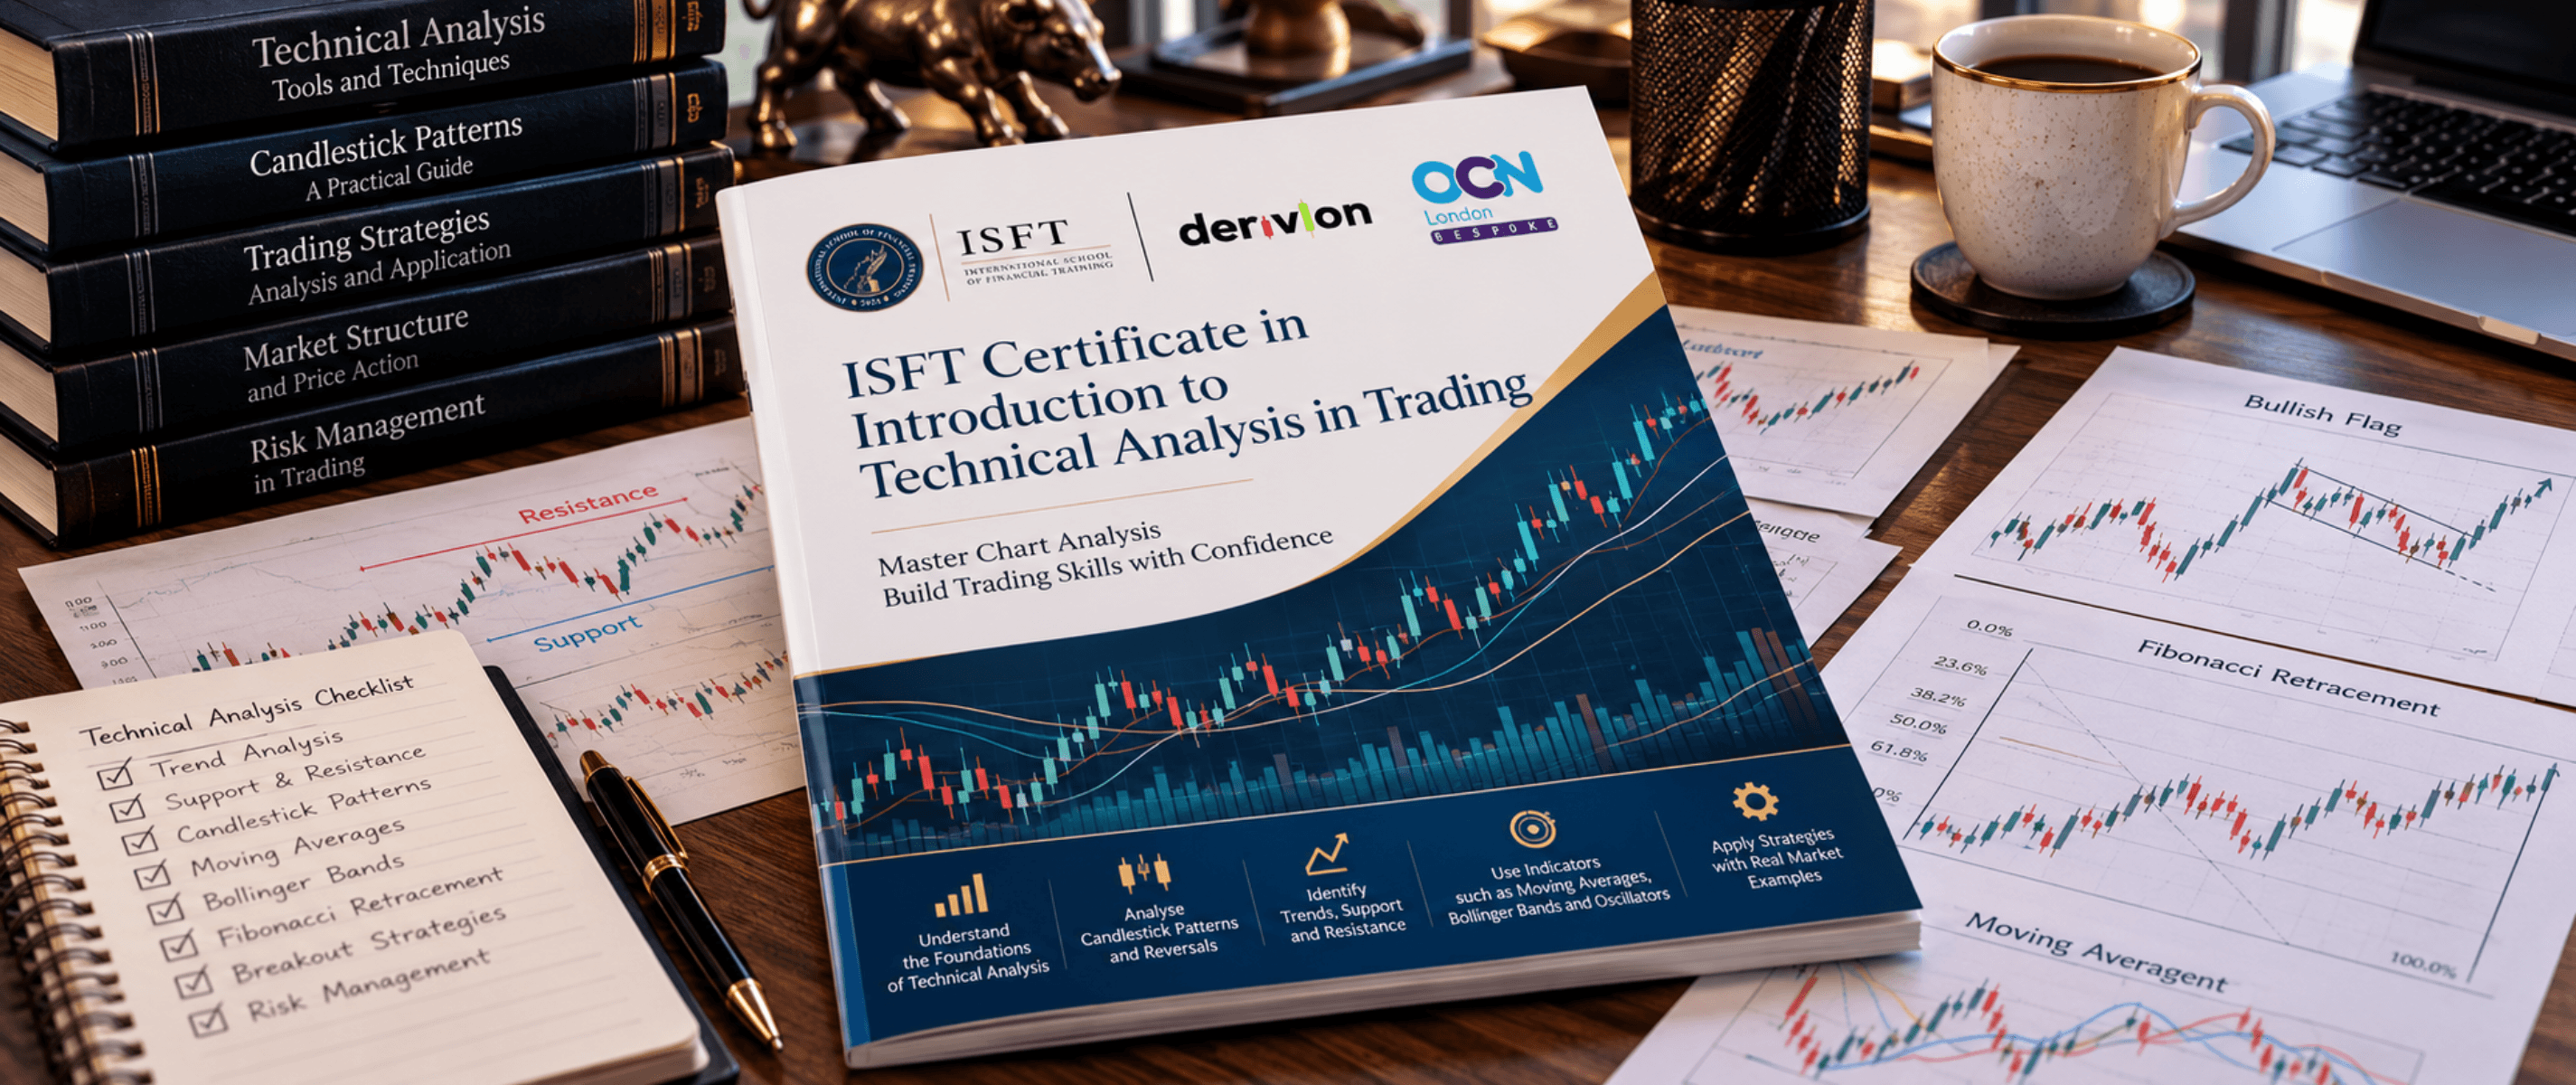
Programme snapshot: ISFT-Series-2: Technical Analysis & Trading Certificate
Why Choose This Programme?
One complete programme: you learn how economic data and central banks move markets, then master the chart, from candlesticks and trends to indicators and market profile, and finish by building and testing a full trade plan.
These are the practical skills employers look for in analyst and trading roles. Chart-reading skills transfer directly across equities, FX, commodities and futures markets.
Study at about 10 hours a week including the live session. Most learners finish in around 24 weeks, and a new batch starts on the 1st of every month.
Core Aim & Reflex
Read the economy, read the chart, build a plan you can test.
One complete certification: twelve modules, two practical projects and a final case, certified through OCN London and ISFT.
Built on real market events: case studies drawn from real central bank decisions and major economic data releases, not textbook theory.
Market-agnostic by design: chart-reading skills that transfer across equities, FX, commodities and futures markets.
A real portfolio, not just a test: a news-trading plan around a real release, then five annotated charts backed by a written report.
Curriculum Architecture
Structured into progressive modules with hands-on scenario analysis, habit drills, and concrete reflection milestones.
Fundamental Analysis and Economic Indicators
The categories of fundamental data traders use, and how key economic indicators move a specified market.
Topics & Episodes
- Identify the main categories of fundamental data used by traders
- Identify how fundamental analysis differs from technical analysis
- Explain the purpose and significance of GDP, inflation and employment data
- Analyse how a given economic indicator release could affect a specified market
- Interpret a simple set of economic data to form a view on likely market direction
- Justify a trading decision using fundamental analysis reasoning
Module quiz: 25 multiple-choice questions in 75 minutes, 70% pass mark, auto-marked online with retakes.
Central Banks and Monetary Policy
How central banks operate, and how their policy decisions ripple through currency, bond and equity markets.
Topics & Episodes
- Explain the core objectives of a central bank, e.g. RBI, US Federal Reserve
- Describe the main tools of monetary policy available to a central bank
- Explain how a change in interest rates can affect currency, bond and equity markets
- Identify the likely market reaction to a hypothetical central bank policy statement
Module quiz: 25 multiple-choice questions in 75 minutes, 70% pass mark, auto-marked online with retakes.
Applied News Trading and Market Strategy
How volatility behaves around scheduled news events, and how to build a structured plan for trading them.
Topics & Episodes
- Explain the risks and opportunities associated with trading economic news releases
- Describe how volatility typically behaves before and after a major news release
- Construct a simple trading plan for a scheduled news event, including entry, risk and exit considerations
- Evaluate the outcome of a news-based trade scenario against the original plan
Module quiz: 25 multiple-choice questions in 75 minutes, 70% pass mark, auto-marked online with retakes.
Economics for Financial Traders
The macroeconomic picture behind the market, applied to a real scheduled release in a written plan and evaluation.
Topics & Episodes
- Explain the relationship between economic growth, inflation and interest rates
- Describe the economic concept of supply and demand as applied to a financial market
- Explain how trade balances and capital flows can affect currency values
- Analyse how an economic development in one country or region could affect Indian markets
- Construct a written trading plan from a real, recent scheduled economic release, including entry, risk and exit considerations
- Evaluate the actual market outcome against the original plan in a written post-event analysis
Project 1: an 800–1,200 word news-trading plan built from a real, scheduled economic release, then a post-event evaluation of how it actually played out against the original plan.
Foundations of Technical Analysis
The core assumptions behind technical analysis, how it compares to fundamental analysis, and the basic tools used to read a price chart.
Topics & Episodes
- Explain the core assumptions underlying technical analysis: price discounts everything, prices move in trends, history repeats
- Compare technical analysis with fundamental analysis as an approach to market analysis
- Identify the main chart types and their relative uses
- Explain how timeframe selection affects technical analysis
Module quiz: 25 multiple-choice questions in 75 minutes, 70% pass mark, auto-marked online with retakes.
Candlestick Patterns: Structure and Types
What each part of a candlestick tells you about price action, and the common single and multi-candle patterns worth recognising.
Topics & Episodes
- Identify the components of a candlestick
- Explain what a candlestick’s shape indicates about price action within a period
- Identify common candlestick patterns including doji, hammer, and engulfing patterns
- Explain the typical market context in which each identified pattern is considered significant
Module quiz: 25 multiple-choice questions in 75 minutes, 70% pass mark, auto-marked online with retakes.
Candlestick Reversal Patterns
The bullish and bearish patterns associated with a potential trend reversal, and how to judge whether one is likely to be reliable.
Topics & Episodes
- Identify common bullish and bearish reversal patterns, e.g. morning star, evening star, shooting star
- Explain the conditions under which a reversal pattern is considered more reliable
- Identify a reversal pattern within a given chart example
- Identify factors that strengthen or weaken the reliability of an identified reversal pattern
Module quiz: 25 multiple-choice questions in 75 minutes, 70% pass mark, auto-marked online with retakes.
Support, Resistance and Breakout Trading
How support and resistance levels are identified on a chart, and how to trade, and manage the risk of, a breakout.
Topics & Episodes
- Explain how support and resistance levels are identified on a price chart
- Describe why previously tested support/resistance levels are considered significant
- Explain what constitutes a price breakout from a support or resistance level
- Identify common false breakout patterns and how traders may manage this risk
Module quiz: 25 multiple-choice questions in 75 minutes, 70% pass mark, auto-marked online with retakes.
Trends, Channels and Wedges
How an uptrend, downtrend or sideways trend is identified and confirmed with a trendline, and what a channel or wedge is telling you.
Topics & Episodes
- Explain how an uptrend, downtrend, and sideways trend are identified using price action
- Describe how trendlines are drawn and used to confirm trend direction
- Identify a price channel and explain its trading significance
- Identify rising and falling wedge patterns and their typical implications
Module quiz: 25 multiple-choice questions in 75 minutes, 70% pass mark, auto-marked online with retakes.
Chart Patterns and Fibonacci Analysis
The classical chart patterns that imply a price target, and how Fibonacci retracement and extension levels are calculated and applied.
Topics & Episodes
- Identify head and shoulders, double top/bottom, and triangle patterns
- Explain the typical price target implied by a given classical chart pattern
- Explain how Fibonacci retracement and extension levels are calculated and applied
- Identify a Fibonacci retracement level on a given chart example and explain its trading relevance
Module quiz: 25 multiple-choice questions in 75 minutes, 70% pass mark, auto-marked online with retakes.
Moving Averages, Bollinger Bands and Oscillators
The difference between a simple and exponential moving average, and how Bollinger Bands and momentum oscillators are used.
Topics & Episodes
- Explain the difference between a simple and exponential moving average
- Describe how moving average crossovers are used to identify potential trend changes
- Explain how Bollinger Bands are constructed and used to assess volatility
- Describe how a momentum oscillator, e.g. RSI, MACD, is used to assess overbought/oversold conditions
Module quiz: 25 multiple-choice questions in 75 minutes, 70% pass mark, auto-marked online with retakes.
Market Profile, Volatility Time Bands and Advanced Tools
The advanced tools professional traders use to read volume at price, then applying every technical analysis concept in a real portfolio.
Topics & Episodes
- Explain the principles of Market Profile analysis and how it represents traded volume at price
- Describe the purpose of Volatility Time Bands and Range Deviation Pivots in identifying significant price levels
- Produce a portfolio of five annotated charts across different markets and timeframes
- Justify the analysis in an accompanying written analytical report referencing appropriate technical concepts
Project 2: a Practical Chart Analysis Portfolio of five annotated charts across different markets and timeframes, backed by a 1,500–2,000 word written analytical report.
Assessment Format
Module quizzes
Every module ends with a quiz: 25 multiple-choice questions in 75 minutes, 70% to pass, auto-marked online, and you can retake it.
Projects & final case
Two projects: an 800–1,200 word news-trading plan and evaluation (Module 4) and a five-chart analysis portfolio with a 1,500–2,000 word report (Module 12), then a one-hour final case once all twelve modules are passed.
Marking
Projects are assessed by the Head Educator against a published marking brief, with feedback within 10 working days and one free resubmission. One overall grade: Pass 70–74%, Merit 75–84%, Distinction 85%+.
Practical Learning Tools & Worksheets
Derivion provides structured toolkits, calculators, and verification workflows so learners apply principles directly to their screens and accounts.
Key Reflexes & Capability Pillars
Read data and policy
Explain how data and central bank policy move markets.
Read and trade charts
Read and trade the main chart patterns and indicators.
Build a trade plan
Build a complete trade plan with an entry, a stop and a target.
Backtest a strategy
Backtest a strategy and judge it by win rate, risk/reward, drawdown and profit factor.
How to Join
Cohorts are scheduled regularly with dedicated timings for individual learners, school batches, and professional groups.
Choose your batch
A new batch starts on the 1st of every month. Study at about 10 hours a week and most learners finish in around 24 weeks.
Learn online
Recorded lessons and notes for every module, at your own pace.
Weekly live session
Ask questions and work through examples with a trainer.
Prove what you know
A quiz after each module, two practical projects, and a final case.
Get certified
Your ISFT Series certificate, OCN London certification and a statement of results.
Programme FAQs
Ready to Join ISFT-Series-2: Technical Analysis & Trading Certificate?
Next cohort starts in 1st of every month. Cohort sizes are intentionally limited.